Traffic Monitoring with VnStat
This is a simple utility that allows you to view load statistics for network interfaces.
You can install VnStat using the following commands:
Debian/Ubuntu
apt install vnstat
CentOS
yum install vnstat
Done. Let’s move on. We can configure what is shown in the utility’s CLI interface using the config file located at /etc/vnstat.conf.
For example, you can specify the network interface that will be monitored by default.
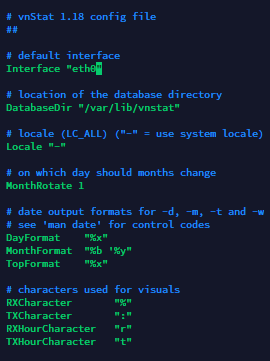
VnStat stores interface statistics databases in /var/lib/vnstat.
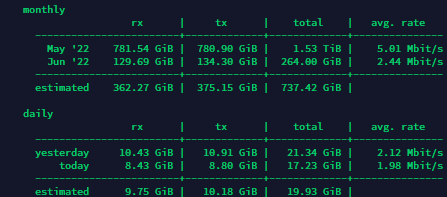
Using the command vnstat -i eth0 you can view aggregated statistics (if any have accumulated) for the load on a specific interface, or for all interfaces if no parameter is specified.
Replace eth0 with the required network interface.
For example, if you want to check the current load on your server’s network channel, you can use the following command. Make sure to specify the correct network interface.
vnstat -l -i eth0
This type of output helps you determine whether the server is under a DDoS attack.
High inbound traffic and a large number of incoming packets do not guarantee that it is exactly this type of attack, but it is definitely a reason to consider using DDoS protection services.