Working with TCPDump: basics and filters
This utility is a useful tool for capturing and collecting packets incoming to the server as well as outgoing from it.
Installing TCPDump
For Ubuntu/Debian:
For Red Hat / CentOS:
Command arguments
- -c — stops packet capture after the specified number of packets is reached.
- -C — sets the maximum dump file size, after which a new file will be created.
- -e — displays link-layer information for each processed packet.
- -F — reads packets from the specified file instead of an interface.
- -f — displays the domain name for each IP address.
- -G — creates a new dump file after the specified period of time.
- -H — adds a constraint so that TCPDump only processes 802.11s headers.
- -i — name of the interface from which packets will be captured. To use all server interfaces, specify any.
- -I — enables monitor mode for the specified interface (to detect all passing packets).
- -E — used to decrypt IPSEC traffic (a decryption key must be provided).
- -K — disables checksum verification for packets.
- -L — shows supported link-layer types for the specified interface.
- -n — skips DNS name resolution in the dump.
- -nn — prints addresses together with their ports.
- -q — minimizes the amount of packet information printed.
- -tttt — prints timestamps for each packet in standard date-time format.
- -v, -vv, -vvv — increasingly verbose packet output.
- -Z — system user on whose behalf the dump file will be created.
- -w — name of the file where the capture will be saved (by default, without this argument the dump is printed in real time without being written to a file).
Usage
To avoid cluttering our capture with unnecessary packets, you should select a specific interface from which you want to collect information instead of all of them. You can view the list of all interfaces using the following command:
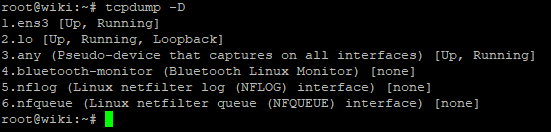
On our virtual servers (VDS) the primary network interface is ens3.
To display logs from our network interface in real time, use the command:
Keep in mind that TCPDump requires superuser privileges, so these commands must be executed as root or with sudo.
After running the command, you will see many rapidly scrolling lines. To stop the capture, use the key combination
Captured data packets look approximately as follows:
However, when different protocols are used, the packet contents may differ.
Let us try to see more detailed information about packets by using the argument.
Now our packets have a more verbose structure such as:
In this case, more detailed information about the IP protocol of the address(es) is visible:
P (tos 0x0, ttl 122, id 61139, offset 0, flags [DF], proto TCP (6)
Filtering arguments
Another powerful feature is additional arguments that let us filter different types of packets by the following parameters:
host — host name.
ip — IP address.
port — port.
proto — protocol.
net — network or subnet address.
src — source.
dst — destination.
Available protocols: tcp, udp, icmp, arp, rarp, decnet, etc.
These arguments can also be combined with each other.
For example, we can display all packets that are sent from our server to a specific destination address:
Or, conversely, all packets that are sent to our server from a source subnet (you can also use a specific IP address, as in the example above):
To search for packets of the required size, you can use arguments such as:
Suppose you have several Garry's Mod servers running on different ports and you want to check whether they are currently being subjected to a DDoS attack. The following command will help:
Pay attention to the specified port range.
Thanks to the -w argument, the capture will be saved to the garrysmod.dump file.
Advanced operators
In addition, TCPDump supports operators for building various combinations of arguments.
AND or && (the "AND" operator)
OR or || (the "OR" operator)
EXCEPT or ! (the "EXCEPT" operator)
For example, we can display all MySQL request traffic that 192.168.1.1 sends to port 3306 (to any destination address).
Conclusion
Thank you for reading! We have taken a detailed look at a very useful tool, TCPDump, which is an integral part of a network engineer's work and will also certainly be useful for regular users.
To inspect packets on Windows, you can use the WireShark application.